Thursday, April 18, 2024

2023 Adjusted Pythagorean Record: Mountain West

Last week we looked at how Mountain West teams fared in terms of yards per play. This week, we turn our attention to how the season played out in terms of the Adjusted Pythagorean Record, or APR. For an in-depth look at APR, click here. If you didn’t feel like clicking, here is the Reader’s Digest version. APR looks at how well a team scores and prevents touchdowns. Non-offensive touchdowns, field goals, extra points, and safeties are excluded. The ratio of offensive touchdowns to touchdowns allowed is converted into a winning percentage. Pretty simple actually. 

Once again, here are the 2023 Mountain West standings.
And here are the APR standings with conference rank in offensive touchdowns, touchdowns allowed, and APR in parentheses. This includes conference games only with the championship game excluded.
Finally, Mountain West teams are sorted by the difference between their actual number of wins and their expected number of wins according to APR.
No Mountain West teams saw their actual record differ significantly from their APR. Similarly, last week we saw that no Mountain West team saw their actual record differ significantly from their expected record based on YPP. The Mountain West was kind of boring in 2023 all things considered. 

What's Up with the Hawaii Bowl?
Since Christmas was on a Monday this past year, the Hawaii Bowl ceded its typical Christmas Eve spot to the NFL. But if you stayed up late on December 23rd, you would have seen something both amazing and mundane. Instead of a rotund Turkish bishop defying both the laws of time and physics you got to see yet another double digit underdog win outright in America's most exotic locale. 

Coastal Carolina entered the Hawaii Bowl on a bit of a skid. After a 2-3 start gave way to a 5-0 run, the Chanticleers dropped their final two regular season games to Army and James Madison. The loss to the Dukes was not competitive. Couple that most recent data point with the continued absence of star quarterback Grayson McCall and the run that San Jose State was on entering the bowl game (six consecutive wins with five coming by double digits) and its easy to see why the Chanticleers were catching ten points in the betting markets. Despite those ominous signs, Coastal Carolina went up 17-0 in the fourth quarter and after a brief run by the Spartans cut the lead to three points, the Chanticleers put a final touchdown on the board to win by ten points. As I mentioned, this was amazing and mundane at the same time. I suppose amazing may be overselling it somewhat, but most college football fans, even partisan Coastal Carolina fans, probably would not have give their team much of a shot. That is of course, unless they had looked at the recent history of the Hawaii Bowl. 
Since 2005, the Hawaii Bowl has seen the most upsets (tied with the Peach/Chick-Fil-A at ten) and most double digit upsets of any bowl game. Including Coastal Carolina in 2023, five underdogs of at least ten points have won the Hawaii Bowl. In 2007, East Carolina upset Boise State as a ten point underdog. In 2009, SMU blasted Nevada 45-10 as a twelve point underdog. One year later, Tulsa pummeled Hawaii as a ten point underdog on Hawaii's homefield. Finally, in 2012, SMU blasted another big favorite (Fresno State) as a thirteen point underdog. While the major upsets took a decade off before resuming with Coastal Carolina's victory in 2023, smaller underdogs won five of the eight Hawaii Bowls contested between 2013 and 2022 (the game was not played in 2020 or 2021). Here are the other bowl games that have seen more than one major upset since 2005. 
Other bowl games can hang with the Hawaii Bowl in terms of overall upsets, but no game has seen more massive upsets. The Hawaii Bowl has accounted for twenty percent of all double digit bowl upsets since 2005! Is there a reason for this? Is the Hawaii Bowl uniquely suited for underdogs? I don't have a definitive answer, but I can think of a few possible explanations. 
  1. Its not a major bowl game -- For all its charm, the Hawaii Bowl will never be confused with the Rose or Sugar Bowl in terms of national importance. This could mean the favorite doesn't take the game quite as seriously as they otherwise might. Which segues perfectly to...
  2. Distractions -- Hawaii is a beautiful place and though I've never been, I'm sure there are plenty of beautiful people on the island (both male and female), that could distract a young football player from the task at hand.
  3. Weird time slot -- The game is typically contested on Christmas Eve, although there have been a few exceptions in the game's history (including 2023). Regardless, the game is always played close to Christmas which could impact the team's preparation for the game. 
  4. Unique travel -- Speaking of preparation, the game is a long way from the continental United State. A flight from Los Angeles to Honolulu takes nearly six hours. The long travel can certainly impact the internal body clocks of the players and coaches. 
  5. Matchups -- In that list of major upsets in the Hawaii Bowl, all the losing teams were from the Group of Five. Despite entering as massive favorites, those Group of Five teams probably had talent levels that were similar to their opponents. They did not have a massive personnel advantage, which is the driving force behind most college football results. 
I would love to hear your thoughts. Why has the Hawaii Bowl seen so many upsets? Is there a reason behind it or is this just noise

Thursday, April 11, 2024

2023 Yards Per Play: Mountain West

Six conferences down, four to go. This week, we head west of the Mississippi and examine the last remaining conglomeration of schools in the western half of the nation. 

Here are the 2023 Mountain West standings.
So we know what each team achieved, but how did they perform? To answer that, here are the Yards Per Play (YPP), Yards Per Play Allowed (YPA) and Net Yards Per Play (Net) numbers for each Mountain West team. This includes conference play only, with the championship game not included. The teams are sorted by Net YPP with conference rank in parentheses.
College football teams play either eight or nine conference games. Consequently, their record in such a small sample may not be indicative of their quality of play. A few fortuitous bounces here or there can be the difference between another ho-hum campaign or a special season. Randomness and other factors outside of our perception play a role in determining the standings. It would be fantastic if college football teams played 100 or even 1000 games. Then we could have a better idea about which teams were really the best. Alas, players would miss too much class time, their bodies would be battered beyond recognition, and I would never leave the couch. As it is, we have to make do with the handful of games teams do play. In those games, we can learn a lot from a team’s YPP. Since 2005, I have collected YPP data for every conference. I use conference games only because teams play such divergent non-conference schedules and the teams within a conference tend to be of similar quality. By running a regression analysis between a team’s Net YPP (the difference between their Yards Per Play and Yards Per Play Allowed) and their conference winning percentage, we can see if Net YPP is a decent predictor of a team’s record. Spoiler alert. It is. For the statistically inclined, the correlation coefficient between a team’s Net YPP in conference play and their conference record is around .66. Since Net YPP is a solid predictor of a team’s conference record, we can use it to identify which teams had a significant disparity between their conference record as predicted by Net YPP and their actual conference record. I used a difference of .200 between predicted and actual winning percentage as the threshold for ‘significant’. Why .200? It is a little arbitrary, but .200 corresponds to a difference of 1.6 games over an eight game conference schedule and 1.8 games over a nine game one. Over or under-performing by more than a game and a half in a small sample seems significant to me. In the 2023 season, which teams in the Mountain West met this threshold? Here are Mountain West teams sorted by performance over what would be expected from their Net YPP numbers.
No Mountain West teams saw their actual record differ significantly from their expected record based on Yards Per Play. Nothing to see here. 

Mountain West Championship Game Minutia
I don't really have a consistent through line for the Mountain West Championship Game (some may argue this blog itself does not have a consistent through line), but I wanted to share two unique facts surrounding the relatively new title game.

Four years ago, I developed the original (I think) concept of 'The People's Champ' for college football leagues. To be The People's Champ, a team had to not win their conference, but beat both teams that participated in the conference title game. Its a relatively rare phenomenon, occurring just nineteen times since conference title games began in 1992. It happened this past season in the Mountain West with Fresno State knocking off both title game participants (Boise State and UNLV) in back to back weeks. After the Boise State victory, the Bulldogs were 4-1 in league play and were in good position to defend their 2022 conference title. But the Bulldogs dropped their final three games, with two coming to bad teams (New Mexico and San Diego State), and they finished two games behind both the Broncos and Rebels. While a People's Championing has happened nineteen times, this marked just the second occurrence in a conference without divisions (Iowa State in 2017 was the other). While it is never easy to be The People's Champ, it is more difficult without divisions. In divisional play, a prospective People's Champ only has to finish behind one team they beat on the field. Without divisions, they must finish behind two. While Fresno State's regular season ended in a disappointing fashion with three consecutive defeats, it was still quite historic. 

Our other Mountain West factoid also involves Fresno State. Compared to other conference title games, the Mountain West Championship Game is spry and youthful. The game has only been contested eleven times. Four of those eleven matchups have featured Boise State against Fresno State (series tied at two apiece). This is tied for the third most common conference title game matchup in all of FBS. 
The SEC had a head start on the rest of the college football world so it is no surprise they have the most common title game matchup with Alabama and Florida facing off an amazing ten times! And let's give some props to the MAC, as Marshall versus Toledo is their most common title game matchup despite the Thundering Herd leaving the league two decades ago. 

Thursday, April 04, 2024

2023 Adjusted Pythagorean Record: MAC

Last week we looked at how MAC teams fared in terms of yards per play. This week, we turn our attention to how the season played out in terms of the Adjusted Pythagorean Record, or APR. For an in-depth look at APR, click here. If you didn’t feel like clicking, here is the Reader’s Digest version. APR looks at how well a team scores and prevents touchdowns. Non-offensive touchdowns, field goals, extra points, and safeties are excluded. The ratio of offensive touchdowns to touchdowns allowed is converted into a winning percentage. Pretty simple actually. 

Once again, here are the 2023 MAC standings.
And here are the APR standings with conference rank in offensive touchdowns, touchdowns allowed, and APR in parentheses. This includes conference games only with the championship game excluded.
Finally, MAC teams are sorted by the difference between their actual number of wins and their expected number of wins according to APR.
Toledo was the only MAC team that saw their actual record differ significantly from their APR. The Rockets finished unbeaten in league play for the first time since 1995. That was mostly due to an unblemished record (4-0) in close games. Half of Toledo's league wins came by a combined fourteen points. This stood in stark contrast to Toledo's close game record from the past few seasons. Between 2020 and 2022, the Rockets were just 3-8 in MAC games decided by a touchdown or less. 

I'm Not Your Steppin' Stone
One of my favorite podcasts, Split Zone Duo, recently recorded an episode where they discussed the lack of opportunities for MAC head coaches in finding better head coaching jobs. I had not considered that MAC head coaches were no longer a talent pool that better schools were drawing from to fill out their head coaching ranks. The podcast gave a convincing argument, but I don't like to take things at face value, so in the spirit of the four-year anniversary of the beginning of the Covid-19 pandemic, I decided to do my own research. 

Since the dawn of the 21st century, seventeen MAC head coaches have departed their jobs in America's heartland (mostly) for better jobs in the FBS landscape. Some continued to climb the coaching ladder and became legends, while others served only brief tenures with their new employer. 
The years listed in the table coincide with their final year as a MAC head coach. You'll notice that in the sixteen seasons between 2000 and 2015, fourteen MAC head coaches took better head coaching jobs. Even if you aren't great at math, you can figure that amounts to a little less than one per season. However, in the eight seasons since, only three MAC head coaches have been hired by better programs. And this is despite a plethora of successful head coaches in the MAC. 

Consider the case of Sean Lewis. His career record is not sparkling (24-31 overall), but he took Kent State to two bowl games and guided the Golden Flashes to a division title. A decade earlier, that was enough to get Darrell Hazell the Purdue job. Despite his success at one of the most difficult FBS jobs, Lewis decided a demotion of sorts was the best way for him to find a better head coaching position. He became the Colorado offensive coordinator under Deion Sanders and despite the fact that he was actually demoted while at Colorado, was able to snag the San Diego State head job when it opened. 

I can think of at least three current successful MAC head coaches who may have to opt for a coordinator gig at a better school before they receive another head coaching opportunity. Alphabetically, they are Jason Candle, Chris Creighton, and Chuck Martin. 

Candle has been the head coach at Toledo for eight seasons. During his tenure, the Rockets have won two MAC titles, three division titles, and never finished below .500. Meanwhile, in a much more difficult job, Creighton has been the head coach at Eastern Michigan for ten seasons. While his overall record looks poor on the surface (52-68), he has guided the Eagles to six bowl games and in 2022, the Eagles won nine games for just the second time in school history. Finally, Chuck Martin has also been in his position for ten years. During that time, Miami has won two MAC titles, and finished with at least a .500 league record for eight consecutive seasons. Despite their individual sustained successes, neither coach has received a better head coaching offer. Why? You can't blame the previous seventeen MAC head coaches who took better jobs. On the whole, they were usually successful hires. 
Thats a conservative rating for each coach. I'm willing to hear an argument that Jerry Kill (illness) and Dino Babers (ten wins in 2018) were successful in their stops at Minnesota and Syracuse respectively. Plus, Tim Beckman was fired at Illinois for issues unrelated to the team's performance on the field. Less than a quarter of those coaches (Turner Gill, Darrell Hazell, and Rod Carey) were truly unsuccessful at their new jobs. What does that mean? Well, for any athletic directors that happen to stumble upon this blog, it means that MAC head coaches might be undervalued. If you are hiring a head coach for say Fresno State, Memphis, or even Vanderbilt in the next couple of years, you could do a lot worse than giving one of these MAC guys a call.

Thursday, March 28, 2024

2023 Yards Per Play: MAC

Hope you enjoyed the first two rounds of the NCAA Tournament, but we are back from our brief intermission. This week, we examine the Big 10's little brother, the MAC.

Here are the 2023 MAC standings.
So we know what each team achieved, but how did they perform? To answer that, here are the Yards Per Play (YPP), Yards Per Play Allowed (YPA) and Net Yards Per Play (Net) numbers for each MAC team. This includes conference play only, with the championship game not included. The teams are sorted by division by Net YPP with conference rank in parentheses.
College football teams play either eight or nine conference games. Consequently, their record in such a small sample may not be indicative of their quality of play. A few fortuitous bounces here or there can be the difference between another ho-hum campaign or a special season. Randomness and other factors outside of our perception play a role in determining the standings. It would be fantastic if college football teams played 100 or even 1000 games. Then we could have a better idea about which teams were really the best. Alas, players would miss too much class time, their bodies would be battered beyond recognition, and I would never leave the couch. As it is, we have to make do with the handful of games teams do play. In those games, we can learn a lot from a team’s YPP. Since 2005, I have collected YPP data for every conference. I use conference games only because teams play such divergent non-conference schedules and the teams within a conference tend to be of similar quality. By running a regression analysis between a team’s Net YPP (the difference between their Yards Per Play and Yards Per Play Allowed) and their conference winning percentage, we can see if Net YPP is a decent predictor of a team’s record. Spoiler alert. It is. For the statistically inclined, the correlation coefficient between a team’s Net YPP in conference play and their conference record is around .66. Since Net YPP is a solid predictor of a team’s conference record, we can use it to identify which teams had a significant disparity between their conference record as predicted by Net YPP and their actual conference record. I used a difference of .200 between predicted and actual winning percentage as the threshold for ‘significant’. Why .200? It is a little arbitrary, but .200 corresponds to a difference of 1.6 games over an eight game conference schedule and 1.8 games over a nine game one. Over or under-performing by more than a game and a half in a small sample seems significant to me. In the 2023 season, which teams in the MAC met this threshold? Here are MAC teams sorted by performance over what would be expected from their Net YPP numbers.
Miami was the only MAC team that saw their actual record differ significantly from their expected record based on YPP. The Redhawks exceeded their expected record, losing just a solitary conference game. The Redhawks did not pile up conference wins thanks to a great close game record (1-1) or fantastic turnover margin (-1). Instead, they fielded great special teams. They ranked nineteenth nationally in yards per punt and as a team they allowed just north of one yard per punt return (sixth nationally). In addition, their kicker, Graham Nicholson (who is also their punter), did not miss a field goal attempt in conference play (seventeen makes). He did miss a kick in the MAC Championship Game, but the Redhawks picked him up and won anyway. 

Losing to FCS Teams
Two MAC school dropped games to FCS teams in 2023. Northern Illinois lost to their in-state brethren (Southern Illinois) and Buffalo lost to another team from the Empire State (Fordham). Akron also needed a miraculous play to avoid losing to Morgan State, but the Zips pulled that one out of the fire. This continued a somewhat disturbing trend for the Bulls and Huskies and for the MAC in general. In the BCS and College Football Playoff Era (since 1998) Buffalo is tied for the most losses among FBS teams to FCS teams. The Bulls have dropped seven games to lower division foes, including two in a row. Northern Illinois is right behind them, having dropped six such games. And of the eleven teams that have lost at least five games to FCS opponents since 1998, five of them either play in the MAC currently or have spent time there in the recent past. 
The Bulls are tied with one of the poorest FBS program (Louisiana-Monroe) and a program that is no longer in FBS (Idaho) for the national lead in losses to FCS teams. Perhaps we should remove one of Idaho's losses as they actually pulled an upset as a FCS team this past year. But, you'll notice the Warhawks have not dropped an FCS game in quite sometime while Buffalo is currently riding a two-game skid to FCS teams. Buffalo opens 2024 with a home game against an FCS team (Lafayette), and while they likely upgraded their head coach in the offseason, Pete Lembo has an FCS loss to his credit during his time at Ball State. The Bulls can certainly get back to the postseason in 2024, but to do so, they will need to play better against FCS opponents. 

Wednesday, March 20, 2024

March Madness Intermission: Final Four Teams that Miss the Next Tournament

Think back to last year's Final Four. There was nary a one seed to be found. Connecticut, seeded fourth, won the title over fifth seed San Diego State. Joining the Huskies and Aztecs in Houston were Miami (fifth seed) and Florida Atlantic (ninth seed). Three of those teams are back in the 2024 NCAA Tournament looking to make another run at the national semifinal. As we noted yesterday, Miami failed to qualify and was not selected for this season's tournament field. How common is that? How often do Final Four teams miss the tournament altogether the next season? Its a little more common than you might think. 
In the previous 38 tournaments since the field expanded in 1985, 30 have failed to make the NCAA Tournament the following season. Just a note. While technically none of the 2019 Final Four teams participated in the 2020 NCAA Tournament, they were all likely to be selected according to Bracket Matrix. Of those 30 teams, some have been ineligible, some have been off true cinderella runs,  and some have been back-to-back champs. Here are those thirty teams that missed the tournament broken down by the seed they earned when they made their run to the Final Four. 
Is that a little surprising to you? I was shocked that one seeds (teams that enjoyed great seasons and were expected to compete for a national title) failed to qualify for the next year's tournament four times as often as cinderella eleven seeds. This is of course, how a more dishonest person would use math to obfuscate the truth. As you probably guessed, one seeds make the Final Four much more often then eleven seeds. In fact, they make it roughly twelve times as often.
Below I have conducted a more honest analysis showing how often each Final Four team by seed fails to qualify for the following season's tournament. 
One and two seeds that make the Final Four have about a one in eight chance of missing the next season's tournament. For individual seeds below the four line, the sample size is too small to give legitimate odds of missing the tournament the following season, but aggregated together, teams seeded five or worse have about a 38% chance of missing the tournament after making a Final Four run. Keep that in mind if we get a surprise run or two in this year's tournament. If you can find decent odds before next season starts of that team missing the NCAA Tournament, put a couple bucks down and send a percentage my way. 

Thanks for reading. We'll be back to our regularly scheduled offseason recaps next week as we review the MAC. Also, if you want some bracket advice, I recommend the magnum opus I wrote following the cancellation of the 2020 NCAA Tournament (don't back Iowa State!). 

Tuesday, March 19, 2024

March Madness Intermission: Teams Ranked in the Preseason Poll Missing the NCAA Tournament

For our second of three March Madness posts, I couldn't really think of a something catchy. But the direct title should give you a pretty good indication of what this post is about, so lets jump right in. 

When the NCAA Tournament field was revealed on Sunday night, four teams that were ranked in the preseason AP Poll were not included in the bracket. Those teams were Miami (preseason 13), Arkansas (14), Southern Cal (21), and Villanova (22). So sixteen percent of the preseason AP Poll either did not qualify or were not selected for the NCAA Tournament. How does this stack up historically compared to the other fields since the tournament expanded in 1985? Its roughly average. In the 39 tournaments since the field expanded, 140 teams that were ranked in the preseason AP Poll did not participate in the NCAA Tournament. That comes out to 3.6 teams per season. But which seasons saw the most teams fail to qualify?
2002 saw eight teams that were ranked in the preseason AP Poll miss out on the NCAA Tournament. Two of those teams (Iowa and Saint Joseph's began the year in the top ten). Of course, total number of teams can only give us so much information. At the bottom of the preseason AP Poll, most writers are probably throwing darts or advocating for darkhorse teams they think might be pretty good in the upcoming season. If a team ranked 25th in the preseason AP Poll misses the tournament, thats not a big whiff. But if a preseason number one is relegated to the NIT, well that seems like a big deal. One way to account for this is via 'Poll Points'. For the preseason top 25, we award more points for better rankings. The team ranked first receives 25 Poll Points, second 24 Poll Points, third 23 Poll Points, and so on until the team ranked 25th receives a solitary Poll Point. Using this methodology, what years saw the most combined preseason Poll Points miss the NCAA Tournament?
This list looks pretty similar to the previous one with 1997 and 2007 replacing 1993 and 2023. If you're curious, 2024 was unremarkable in terms of Poll Points. The four teams ranked in the preseason AP Poll accumulated 34 total Poll Points. 

Before we leave, lets give the pollsters some credit for years they nailed it with the preseason poll. In three instances since the field expanded, each team ranked in the preseason AP Poll ended up playing in the NCAA tournament. 
1986 and 1988 have asterisks because the preseason AP Poll only included twenty teams those seasons. The poll would not expand to include 25 teams until 1990. Therefore, the dawn of Y2K ranks as the pollsters most accurate preseason prognostication. 

Monday, March 18, 2024

March Madness Intermission: Fewest NCAA Tournament Wins

We are taking a short break from our normal offseason posts to celebrate our nation's seminal event, the NCAA Tournament. This week, we'll have a few posts on statistical minutia that may help you fill out your tournament bracket or may just give you an opportunity to impress your friends and neighbors with tournament facts. First up, we are going to look at current power conference teams with the fewest NCAA tournament wins since the field expanded in 1985. Some of them might even be in the field this year.

Before we get started, we need to define what we mean by 'Power Conference'. For this exercise, we are going to include teams that are currently members of the ACC, Big East, Big 10, Big 12, Pac-12, and SEC. The Atlantic 10 and American Athletic Conference have both been pseudo power conferences at different points in their existence, but many of the best teams from those league's have been gobbled up by the other six conferences. Oh, and one other thing. We are only going to consider victories in the Round of 64 and beyond. No matter how they are branded, First Four games, are play-in games and if you lose in those, did you even make the real tournament? 

Let's begin with current power conference teams that have won exactly four tournament games since the field expanded. 
Three SEC schools have won just four tournament games in the past forty years. Ironically, Georgia has been coached by four men in that span with a Final Four appearance. Hugh Durham took Georgia to the Final Four two seasons before the field expanded (1983), but only managed a single tournament win at Georgia after that run to the national semifinal. Tubby Smith took Georgia on their deepest run in the expanded field in 1996 before he won a national title two years later at Kentucky. Jim Harrick, a national title winning coach at UCLA, guided Georgia to two tournaments, but won just a single game before leaving the school in disgrace. Finally, former Marquette and Indiana coach Tom Crean was never able to get Georgia to the tournament during his tenure. Ole Miss was on the business end of Bryce Drew's miracle shot in 1998, but Rod Barnes did win three tournament games at the school, including two in 2001 to get them to the Sweet 16. Andy Kennedy technically won two games during his tenure in Oxford, but one came in the First Four. South Carolina has only won four tournament games since the field expanded, but they clustered those wins in perfect sequence on the way to the Final Four in 2017. The other power conference team to be stuck on four wins is Virginia Tech. The Hokies made tourney appearances as members of the Metro and later Atlantic 10 before joining the ACC. A perpetual bubble team under Seth Greenberg, the Hokies made their deepest run under Buzz Williams in 2019.

What about teams that have won exactly three tournament games since the field expanded?
Like the SEC with four-win teams, one league (the Pac-12) is overrepresented with three-win teams. Colorado has not advanced past the second round since the field expanded in 1985. Oregon State went 26 years between tournament appearances, but consolidated all their wins in one season during their Elite 8 run in 2021. Washington State has been coached by two men who found greater success once they left Pullman (Kelvin Sampson and Tony Bennett) and have not advanced past the Sweet 16 in the expanded tournament field. TCU is the only other power conference team to win exactly three tournament games since the field expanded. The Horned Frogs have bounced around, playing in the Southwest Conference, WAC, Conference USA, and Mountain West, before finding a home in the Big 12. Along the way, they have never advanced past the second round. 

There is only one team that has won exactly two NCAA Tournament games since 1985. 
Northwestern did not even qualify for their first NCAA Tournament until 2017. As the old adage goes, you can't be upset in the first round if you never make the tournament. Give the Wildcats credit, their first round win rate is 100% as they have won their opener in both tourney appearances. 

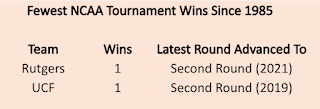
We are getting close to the bottom. Which teams have won exactly one game since the field expanded? 
The Rutgers basketball program has been nearly as destitute, perhaps more so, than their football team. The Scarlet Knights went three decades between tournament appearances. They won their first tournament game in nearly 40 years in 2021 and played a great second round game in nearly upsetting a Final Four bound Houston team. UCF made four tournament appearances under Kirk Speraw in the 90s and early 2000s when they were members of the TAAC/Atlantic Sun. Those were low-major leagues, so the Knights received very low seeds (never higher than 14). They returned to the tournament in 2019 under Johnny Dawkins, won their first ever tournament game, and gave top-seeded Duke a run for their money in the second round. 

And finally, let's hear it for the only power conference team to have not won a tournament game since the field expanded. 
In fact, the Cornhuskers have never won a tournament game in their entire history. They did not make the NCAA field until 1986, and despite four consecutive appearances between 1991 and 1994, including a three seed in 1991, failed to win a single tournament game. Is this the year? Can Nebraska finally garner their first tournament victory? If so, it might be time to build a state of Fred Hoiberg in Lincoln.